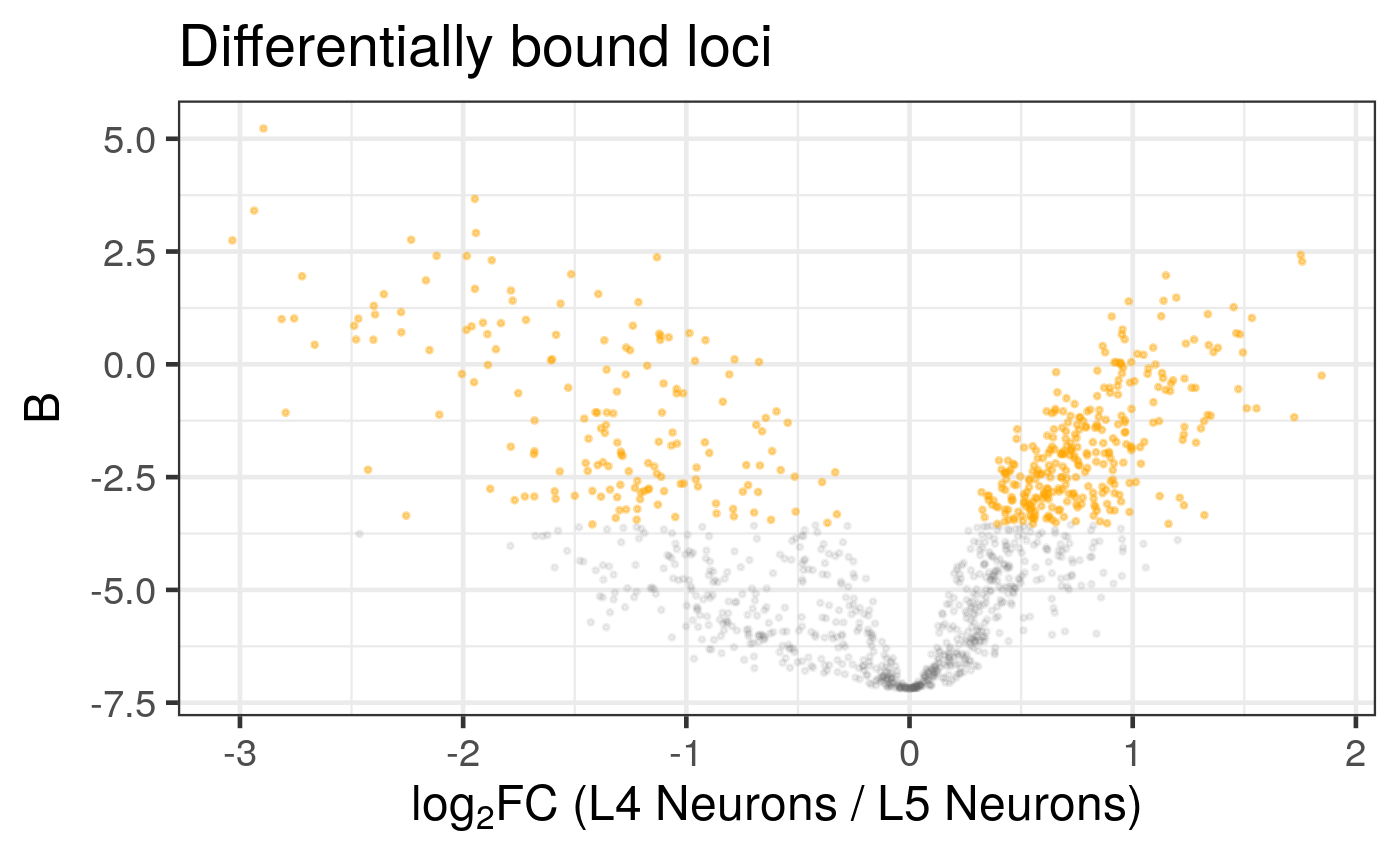
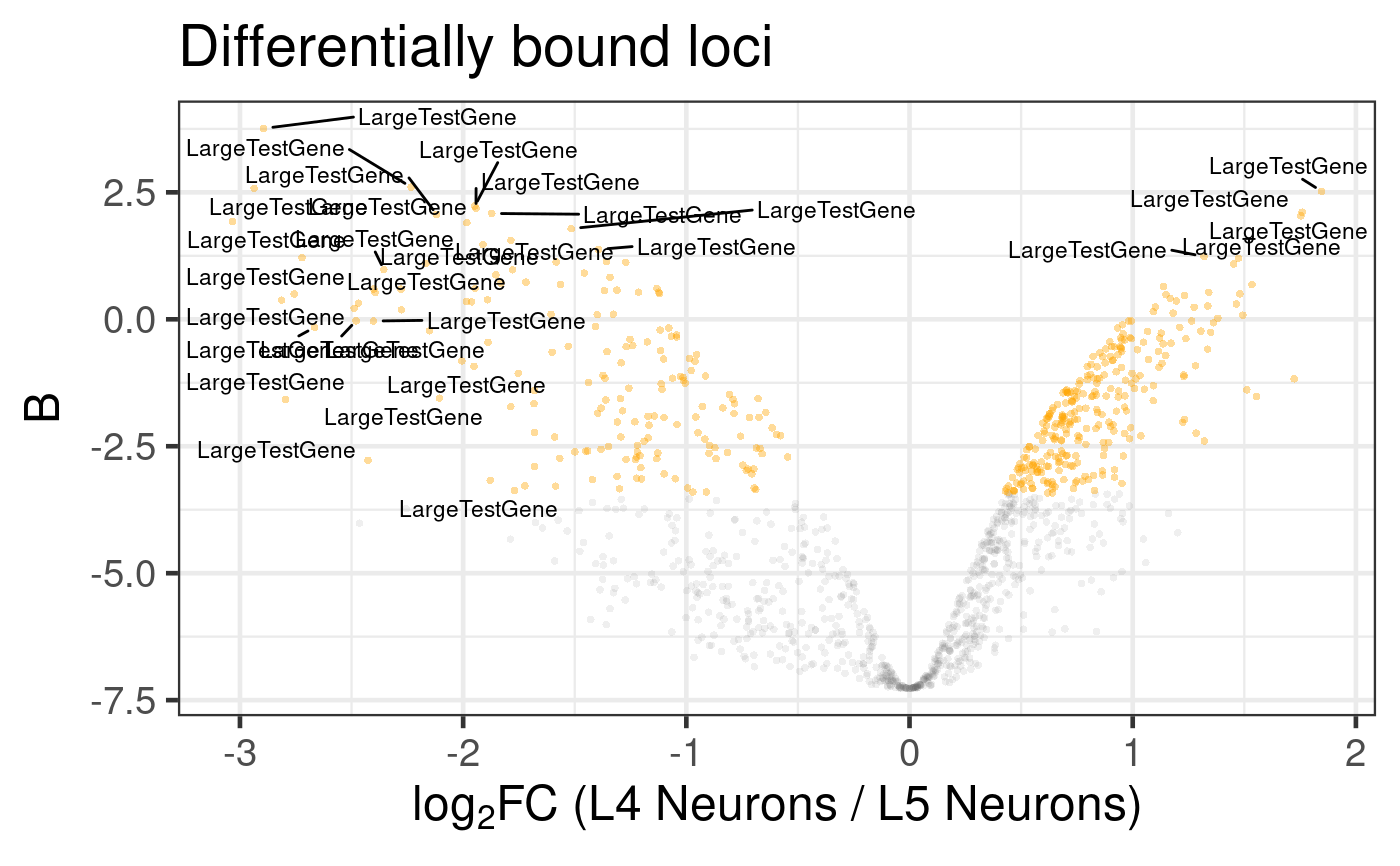
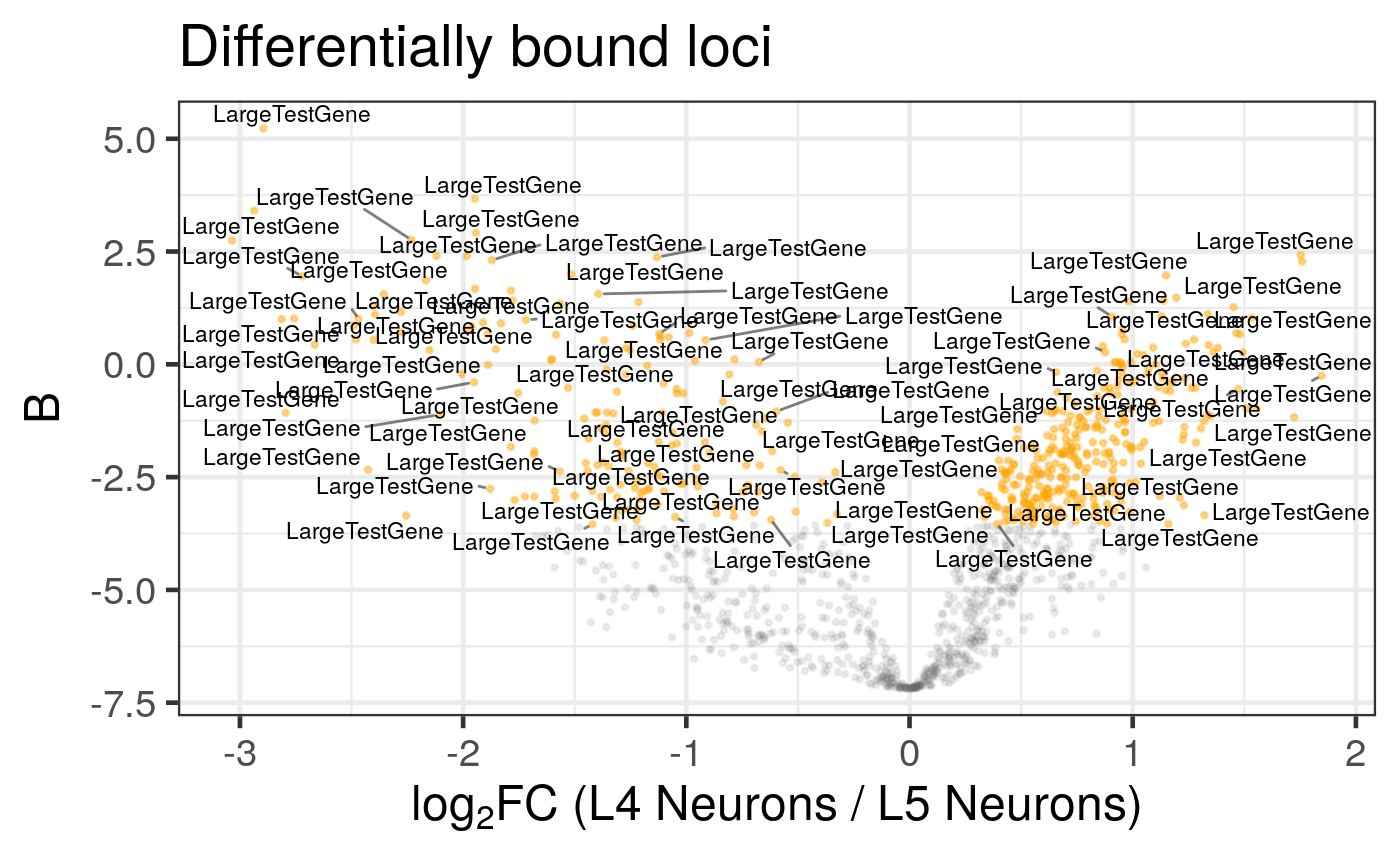
Creates a volcano plot from the results of a differential analysis. The plot shows the log-fold change against a measure of statistical significance. The function offers extensive customisation for point appearance, gene labelling, and highlighting specific groups of loci.
Arguments
- diff_results
A `DamIDResults` object, as returned by `differential_binding()` or `differential_accessibility()`.
- labels
Character; one of `"all"`, `"highlight"`, or a character vector containing one or more group names from the `highlight` list.
"all"(default): Labels both the general significant loci (based onlabel_config) and any highlight groups wherelabel = TRUEis set inhighlight_config."highlight": Labels all loci in thehighlightlist, ignoringlabel_configand thelabeltoggle inhighlight_config.vector of group names: Labels only the specified groups from thehighlightlist.
- fdr_filter_threshold
Numeric or NULL. If a value (e.g., 0.05) is provided, the volcano plot will only include loci that have an FDR value less than or equal to this threshold in at least one replicate of the two conditions being plotted. This requires that the data was loaded using `load_data_genes` with `calculate_occupancy_pvals = TRUE`, which generates the necessary `_FDR` columns. If `NULL` (default), no FDR-based filtering is performed.
- highlight_by
Character; either `"auto"`, `"gene_name"`, or `"id"`. Determines whether to use gene names (`"gene_name"`) or locus (`"id"`) for the highlight search. In `"auto"` mode (default), the function checks for matches in both columns and selects the one with the best coverage for each highlight group.
- plot_config
List. Names to override plot details (title, axes, size, colours, etc); see details.
title,xlab,ylab(character)ystat(character): The column name from `analysisTable(diff_results)` to use for the y-axis (e.g., "minuslogp" or "B"). Default is "B".base_size(integer): ggplot theme base font size.sig_colour,nonsig_colour(colours)sig_alpha,sig_size: alpha and size for significant points.nonsig_alpha,nonsig_size: alpha and size for non-significant points.
- label_config
List. Fine-grained label controls; if missing or `NULL`, no labels are added (see details).
genes: character vector to restrict labels to a subset (default: label all significant).label_size: label size (numeric).clean_names: logical; if `TRUE`, applies regex filtering to labels.names_clean,names_clean_extra: regex to exclude from labels whenclean_namesis `TRUE`.max_overlaps: integer; maximum ggrepel overlaps. (default: 10)
- highlight
List. A simple list where each element is a character vector of genes/loci to highlight. Each element of this list will correspond to a separate highlight group. If `NULL`, no highlight overlays are drawn.
- highlight_config
List. Additional highlight configuration options, applied consistently across all highlight groups. If missing or `NULL`, defaults are used.
alpha: Numeric; transparency for highlight points (default: 1).size: Numeric; size for highlight points (default: 2).label: Logical; if `TRUE`, labels are added for all highlight groups (default: `FALSE`).colour: A list of colours, where each element corresponds to a highlight group in the `highlight` list. If not specified or not enough colours are provided, a default hue palette is used.label_size: Numeric; label size (default: 4).max_overlaps: Integer; maximum ggrepel overlaps for highlight labels (default: 10).sig_labels_only: Logical; whether to only label significant loci in the setlegend: Logical; whether to draw a plot legend for the highlight groups (default: TRUE).legend_inside: Logical; whether to draw the plot legend for the highlight groups inside the plot (default: TRUE).legend_inside_pos: String, either 'r' (right) or 'l' (left). Presets for internal legend position in the bottom right or left corners of the plot. (default: 'r')legend_position_override: Numeric. Manual override for internal legend positioning when not set to the default, NULL.legend_justification_override: Numeric. Manual override for internal legend justification when not set to the default, NULL.label_fill: logical; if `TRUE`, uses `geom_label_repel`, else `geom_text_repel` (default: FALSE)text_col: logical; if `TRUE`, text is coloured as per points, else black (default: FALSE)text_luminosity: Numeric (0-100). When using `text_col`, setting a non-zero value will darken the luminosity of the highlight colour on text labels for increased contrast. 0 = no change; 100 = black. (default: 0)
- label_display
List. Additional label display options for sampling dense labels in all groups. Uses KNN-based sampling to optimise display when not NULL.
scale: Logical; ifTRUE, labelled coordinate data are centred and scaled (usingscale(center = TRUE, scale = TRUE)) before sampling. Note: this does not affect plotted values. (default:TRUE).r: Numeric or"auto"; the sampling exclusion radius. If"auto",ris set to the median distance to thek_for_r-th nearest neighbour across all points. A smallerrkeeps more points. (Default: 0.2).k_search: Integer; maximum number of neighbours to find in the initial KNN search. Must be greater than or equal to bothkandk_for_r(default: 30).k_priority: Integer; number of neighbours used to infer the isolation priority score. Must be less than or equal tok_search(default: 30).k_for_r: Integer; which neighbour to use for the"auto"rcalculation (default: 30).
- save
List or `NULL`. Controls saving the plot to a file. If `NULL`, `FALSE`, or `0`, the plot is not saved. If a
list, it specifies saving parameters:filename(character): The path and base name for the output file (e.g., "my_volcano_plot"). If not specified, a default is used.format(character): File format ("pdf", "svg", or "png"). Default is "pdf".width(numeric): Width of the plot in inches. Default is 5.height(numeric): Height of the plot in inches. Default is 4.
Examples
# Helper function to create a sample DamIDResults object
.generate_example_results <- function() {
mock_genes_gr <- GenomicRanges::GRanges(
seqnames = S4Vectors::Rle("2L", 7),
ranges = IRanges::IRanges(
start = c(1000, 2000, 3000, 5000, 6000, 7000, 8000),
end = c(1500, 2500, 3500, 5500, 6500, 7500, 20000000)
),
gene_id = c("FBgn001", "FBgn002", "FBgn003", "FBgn004", "FBgn005", "FBgn006", "FBgn007"),
gene_name = c("ap", "dpr1", "side", "mav", "geneE", "geneF", "LargeTestGene")
)
data_dir <- system.file("extdata", package = "damidBind")
loaded_data <- load_data_peaks(
binding_profiles_path = data_dir,
peaks_path = data_dir,
ensdb_genes = mock_genes_gr,
quantile_norm = TRUE
)
diff_results <- differential_binding(
loaded_data,
cond = c("L4 Neurons" = "L4",
"L5 Neurons" = "L5")
)
return(diff_results)
}
diff_results <- .generate_example_results()
#> Warning: The 'quantile_norm' argument is deprecated. Please use 'norm_method' instead.
#> Locating binding profile files
#> Building binding profile dataframe from input files ...
#> - Loaded: Bsh_Dam_L4_r1-ext300-vs-Dam.kde-norm
#> - Loaded: Bsh_Dam_L4_r2-ext300-vs-Dam.kde-norm
#> - Loaded: Bsh_Dam_L5_r1-ext300-vs-Dam.kde-norm
#> - Loaded: Bsh_Dam_L5_r2-ext300-vs-Dam.kde-norm
#> Locating peak files
#> Applying 'quantile' normalisation to binding profiles
#> Calculating occupancy over peaks
#> Calculating average occupancy for 1208 regions...
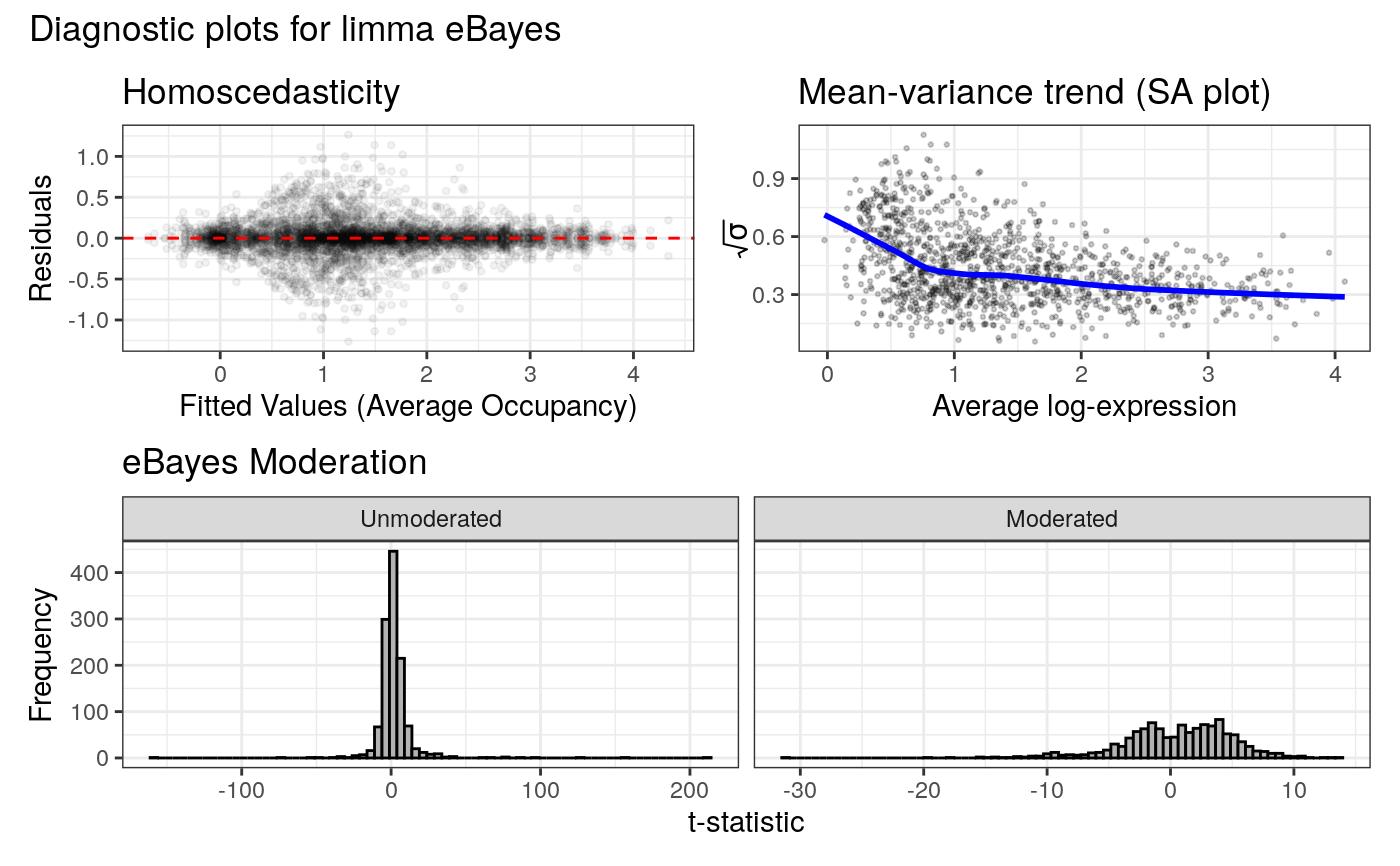
#> Generating diagnostic plots...
 #> Condition display names were sanitized for internal data:
#> 'L4 Neurons' -> 'L4.Neurons'
#> 'L5 Neurons' -> 'L5.Neurons'
#> Applying filter: Loci must have occupancy > 0 in at least 2 samples of at least one condition.
#> Filtered out 12 loci. 1196 loci remain for analysis.
#> Differential analysis setup:
#> Condition 1 Display Name: 'L4 Neurons' (Internal: 'L4.Neurons', Match Pattern: 'L4')
#> Found 2 replicates:
#> Bsh_Dam_L4_r1-ext300-vs-Dam.kde-norm_qnorm
#> Bsh_Dam_L4_r2-ext300-vs-Dam.kde-norm_qnorm
#> Condition 2 Display Name: 'L5 Neurons' (Internal: 'L5.Neurons', Match Pattern: 'L5')
#> Found 2 replicates:
#> Bsh_Dam_L5_r1-ext300-vs-Dam.kde-norm_qnorm
#> Bsh_Dam_L5_r2-ext300-vs-Dam.kde-norm_qnorm
#> limma contrasts: L4.Neurons-L5.Neurons
#> Applying eBayes moderation with `trend = TRUE, robust = TRUE`
#>
#> Filtering for positive enrichment (mean score > 0 in the enriched condition).
#>
#> 316 loci enriched in L4 Neurons
#> Highest-ranked genes:
#> LargeTestGene, LargeTestGene, LargeTestGene, LargeTestGene, LargeTestGene, LargeTestGene, LargeTestGene, LargeTestGene, LargeTestGene, LargeTestGene
#>
#> 166 loci enriched in L5 Neurons
#> Highest-ranked genes:
#> LargeTestGene, LargeTestGene, LargeTestGene, LargeTestGene, LargeTestGene, LargeTestGene, LargeTestGene, LargeTestGene, LargeTestGene, LargeTestGene
#> Displaying diagnostic plots...
#> Condition display names were sanitized for internal data:
#> 'L4 Neurons' -> 'L4.Neurons'
#> 'L5 Neurons' -> 'L5.Neurons'
#> Applying filter: Loci must have occupancy > 0 in at least 2 samples of at least one condition.
#> Filtered out 12 loci. 1196 loci remain for analysis.
#> Differential analysis setup:
#> Condition 1 Display Name: 'L4 Neurons' (Internal: 'L4.Neurons', Match Pattern: 'L4')
#> Found 2 replicates:
#> Bsh_Dam_L4_r1-ext300-vs-Dam.kde-norm_qnorm
#> Bsh_Dam_L4_r2-ext300-vs-Dam.kde-norm_qnorm
#> Condition 2 Display Name: 'L5 Neurons' (Internal: 'L5.Neurons', Match Pattern: 'L5')
#> Found 2 replicates:
#> Bsh_Dam_L5_r1-ext300-vs-Dam.kde-norm_qnorm
#> Bsh_Dam_L5_r2-ext300-vs-Dam.kde-norm_qnorm
#> limma contrasts: L4.Neurons-L5.Neurons
#> Applying eBayes moderation with `trend = TRUE, robust = TRUE`
#>
#> Filtering for positive enrichment (mean score > 0 in the enriched condition).
#>
#> 316 loci enriched in L4 Neurons
#> Highest-ranked genes:
#> LargeTestGene, LargeTestGene, LargeTestGene, LargeTestGene, LargeTestGene, LargeTestGene, LargeTestGene, LargeTestGene, LargeTestGene, LargeTestGene
#>
#> 166 loci enriched in L5 Neurons
#> Highest-ranked genes:
#> LargeTestGene, LargeTestGene, LargeTestGene, LargeTestGene, LargeTestGene, LargeTestGene, LargeTestGene, LargeTestGene, LargeTestGene, LargeTestGene
#> Displaying diagnostic plots...
 # Generate a default volcano plot
plot_volcano(diff_results)
#> Label sampling: coordinates have been centred and scaled.
#> Warning: ggrepel: 1 unlabeled data points (too many overlaps). Consider increasing max.overlaps
# Generate a default volcano plot
plot_volcano(diff_results)
#> Label sampling: coordinates have been centred and scaled.
#> Warning: ggrepel: 1 unlabeled data points (too many overlaps). Consider increasing max.overlaps
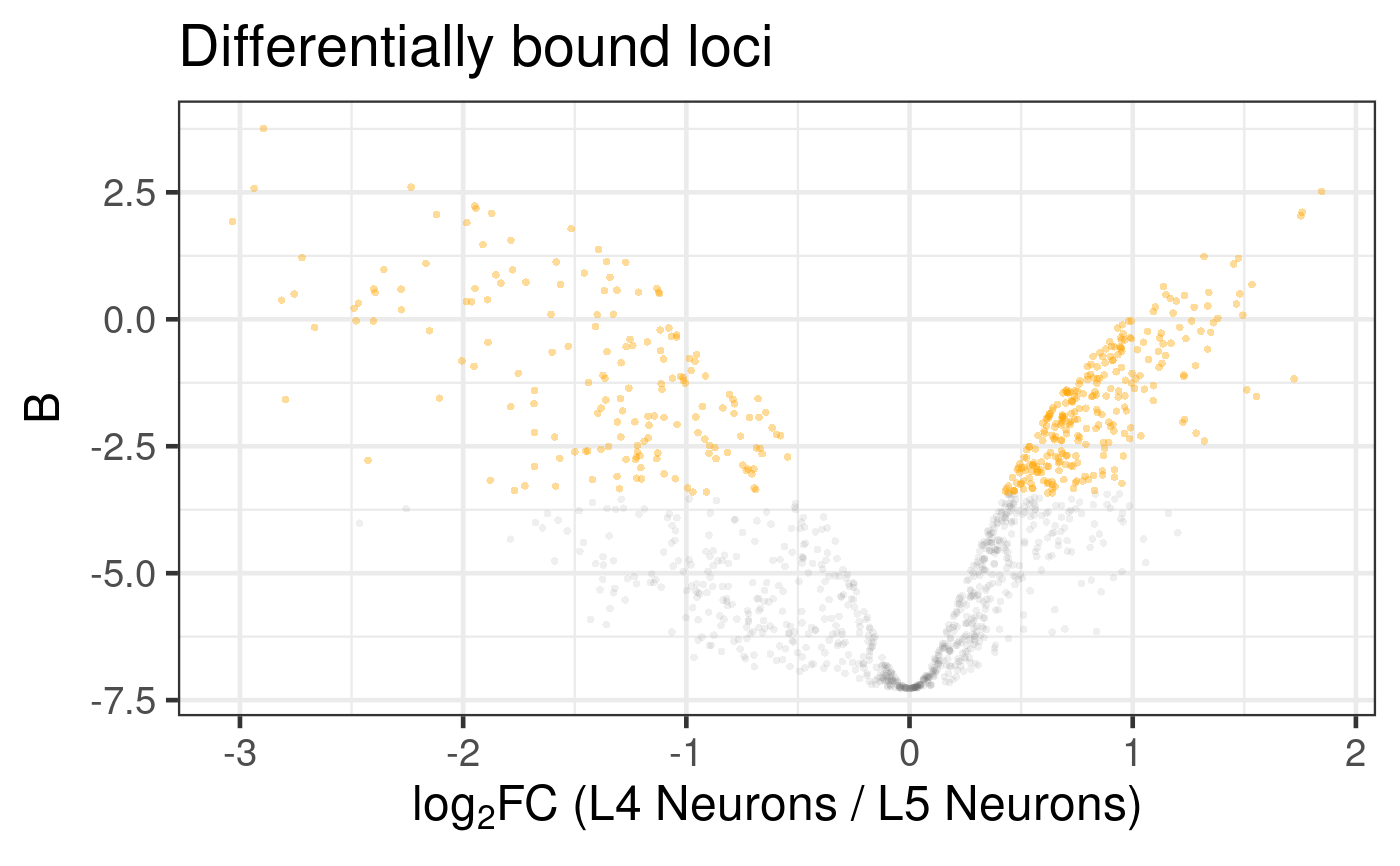
 # Explicitly highlight a specific locus coordinate
plot_volcano(diff_results, highlight = list("My Peak" = "2L:1000-1500"))
#> Label sampling: coordinates have been centred and scaled.
#> Warning: ggrepel: 1 unlabeled data points (too many overlaps). Consider increasing max.overlaps
# Explicitly highlight a specific locus coordinate
plot_volcano(diff_results, highlight = list("My Peak" = "2L:1000-1500"))
#> Label sampling: coordinates have been centred and scaled.
#> Warning: ggrepel: 1 unlabeled data points (too many overlaps). Consider increasing max.overlaps
 # Label only specific highlight groups
plot_volcano(diff_results,
highlight = list("Set A" = c("ap", "side"), "Set B" = "mav"),
labels = "Set A")
# Label only specific highlight groups
plot_volcano(diff_results,
highlight = list("Set A" = c("ap", "side"), "Set B" = "mav"),
labels = "Set A")