Load genome-wide binding data and associated peak files or GRanges objects
Source:R/load_data.R
load_data_peaks.RdReads DamID-seq log2 ratio binding data either from bedGraph files or directly from a list of GRanges objects, and associated peak regions either from GFF/bed files or from a list of GRanges objects. This function is suitable for transcription factor binding analyses. For peak discovery, use an external peak caller (e.g. 'find_peaks').
Usage
load_data_peaks(
  binding_profiles_path = NULL,
  peaks_path = NULL,
  binding_profiles = NULL,
  peaks = NULL,
  drop_samples = NULL,
  maxgap_loci = 1000,
  norm_method = c("none", "loess", "quantile", "rpm"),
  pre_scale = FALSE,
  quantile_norm = NULL,
  organism = "drosophila melanogaster",
  ensdb_genes = NULL,
  BPPARAM = BiocParallel::bpparam(),
  plot_diagnostics = interactive()
)
Arguments
- binding_profiles_path
Character vector. Path(s) to directories or file globs containing log2 ratio binding tracks in bedGraph format. Wildcards ('*') supported.
- peaks_path
Character vector. Path(s) to directories or file globs containing the peak calls in GFF or BED format.
- binding_profiles
A list of GRanges objects (one per sample) or a single GRanges object containing multiple sample metadata columns.
- peaks
A list of GRanges objects (one per sample) or a single GRanges object representing the union of peaks.
- drop_samples
A character vector of sample names or patterns to remove. Matching samples are removed from the analysis before normalisation and occupancy calculation. This can be useful for excluding samples that fail initial quality checks. Default: `NULL` (no samples are dropped).
- maxgap_loci
Integer, the maximum bp distance between a peak boundary and a gene to associate that peak with the gene. Default: 1000.
- norm_method
Character. Determines how raw genome-wide signal is normalised prior to establishing peak specific occupancy. Options are:
"none"(default): Use original data. Recommended if loading CATaDa count data pre-processed viadamidseq_pipeline --catada(which is natively RPM-normalised)."loess": Uses the `cyclicloess` method from `limma`."quantile": Quantile normalisation. Forces identical target distributions."rpm": Reads Per Million scaling. A simple global scaling for raw un-normalised count data. Use with caution: do not use for log2 ratio data, and avoid if CATaDa data has already been RPM normalised (the default behaviour with `damidseq_pipeline`)
- pre_scale
Logical. If TRUE, samples will be scaled without centering via base R `scale(center=FALSE, scale=TRUE)`, prior to normalisation being applied. default is FALSE; generally useful for DamID log-ratio data, but not recommended for CATaDa data.
- quantile_norm
Deprecated. Please use `norm_method = "quantile"` instead.
- organism
Organism string (lower case) to obtain genome annotation from (if not providing a custom `ensdb_genes` object) Default: "drosophila melanogaster".
- ensdb_genes
GRanges object: gene annotation. Automatically obtained from `organism` if NULL.
- BPPARAM
BiocParallel function (defaults to BiocParallel::bpparam())
- plot_diagnostics
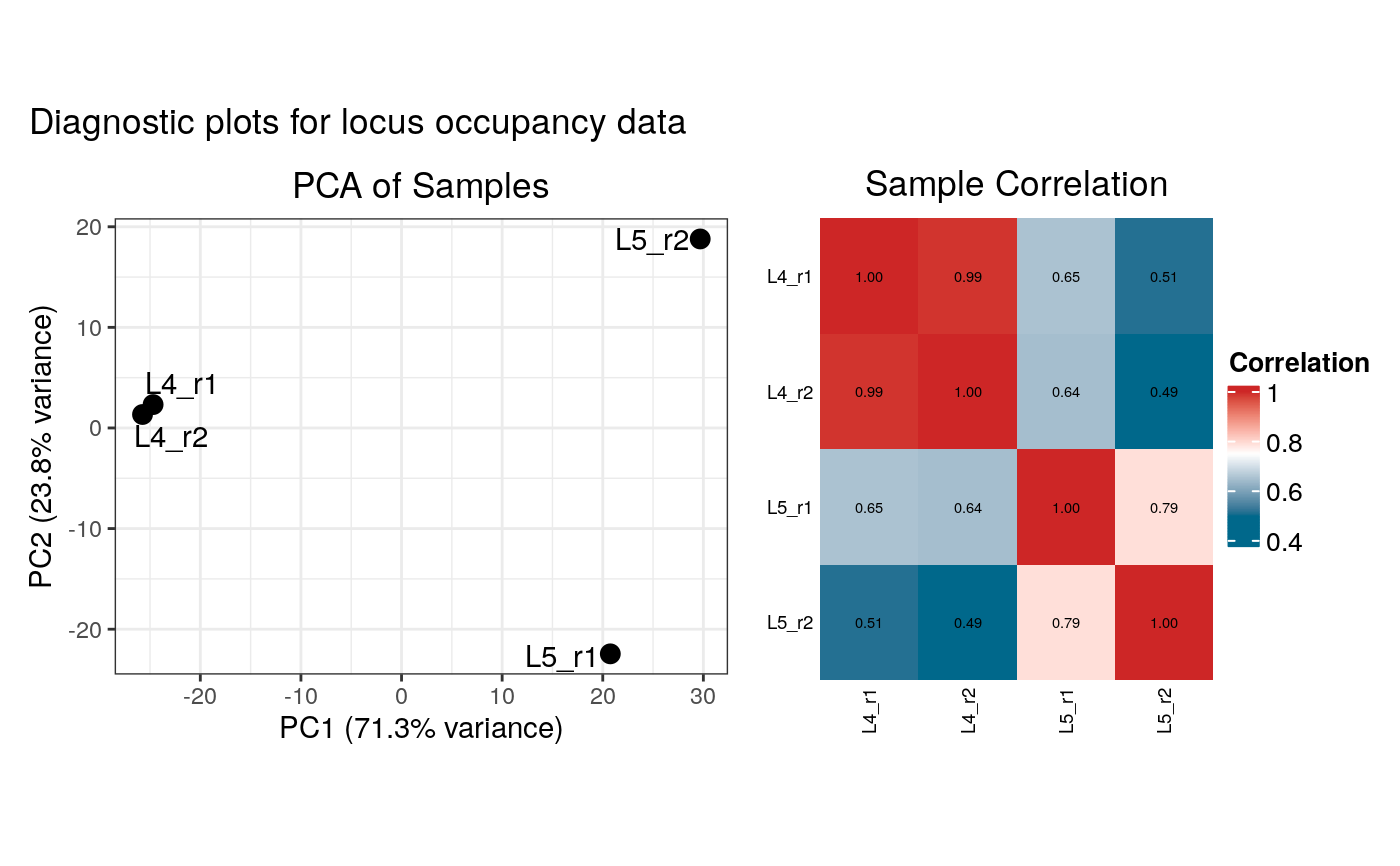
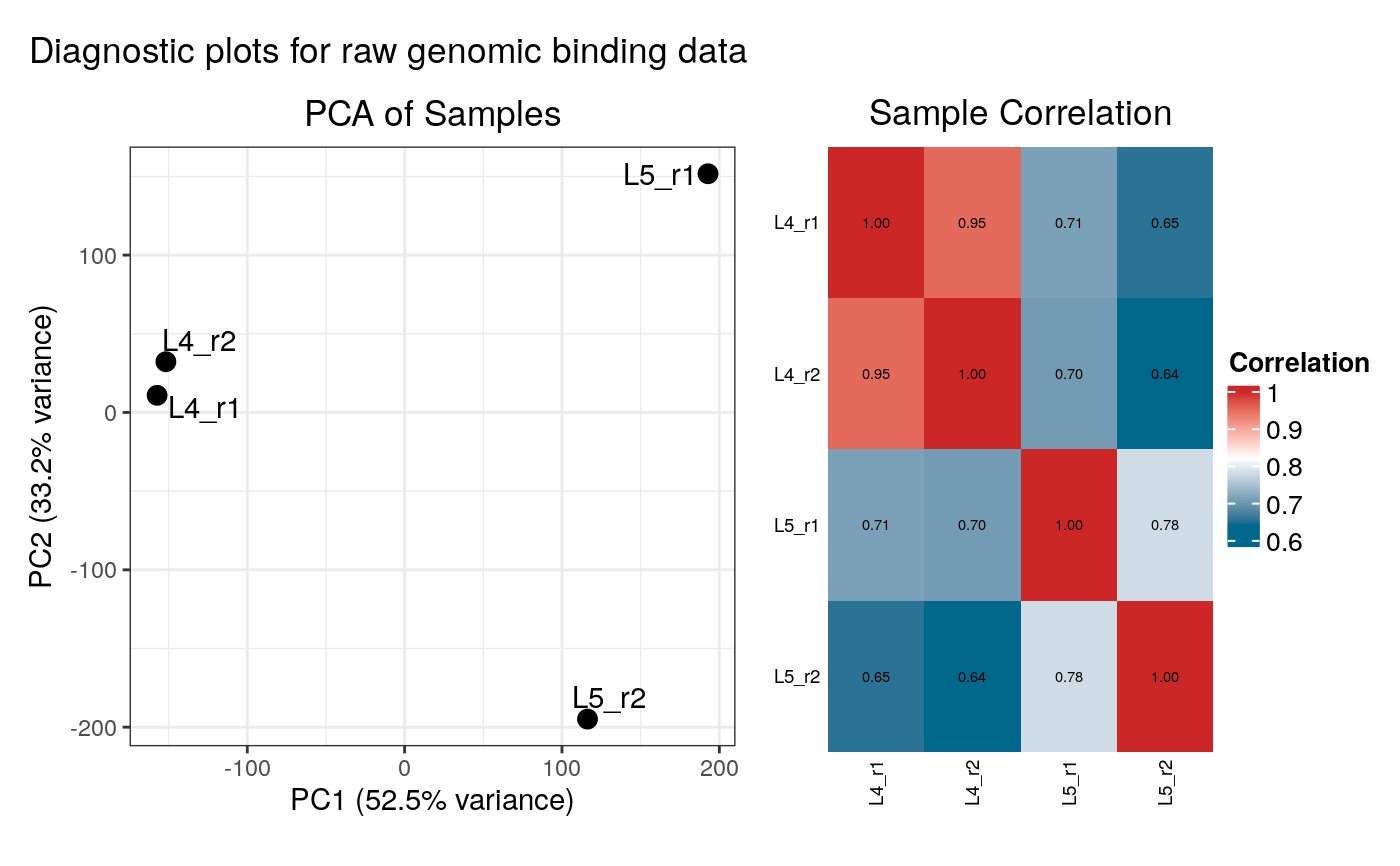
Logical. If `TRUE` (the default in interactive sessions), diagnostic plots (PCA and correlation heatmap) will be generated and displayed for both the raw binding data and the summarised occupancy data.
Value
A list with components:
- binding_profiles_data
GRanges: Signal matrix for all regions, with genomic coordinates and sample metadata columns.
- peaks
list(GRanges): All loaded peak regions.
- pr
GRanges: Reduced (union) peak regions across samples.
- occupancy
data.frame: Binding values summarised over reduced peaks, with overlap annotations.
- test_category
Character scalar; will be "bound".
- metadata
List: Data provenance and analysis metadata.
Details
One of `binding_profiles_path` or `binding_profiles` must be provided. Similarly, one of `peaks_path` or `peaks` must be provided.
When supplying GRanges lists for `binding_profiles`, each GRanges should contain exactly one numeric metadata column representing the binding signal, and all GRanges should be supplied as a named list, with element names used as sample names. Alternatively, a single GRanges object already containing multiple sample columns may be provided.
Examples
# Create a mock GRanges object for gene annotation
# This object, based on the package's unit tests, avoids network access
# and includes a very long gene to ensure overlaps with sample data.
mock_genes_gr <- GenomicRanges::GRanges(
    seqnames = S4Vectors::Rle("2L", 7),
    ranges = IRanges::IRanges(
        start = c(1000, 2000, 3000, 5000, 6000, 7000, 8000),
        end = c(1500, 2500, 3500, 5500, 6500, 7500, 20000000)
    ),
    strand = S4Vectors::Rle(GenomicRanges::strand(c("+", "-", "+", "+", "-", "-", "+"))),
    gene_id = c("FBgn001", "FBgn002", "FBgn003", "FBgn004", "FBgn005", "FBgn006", "FBgn007"),
    gene_name = c("geneA", "geneB", "geneC", "geneD", "geneE", "geneF", "LargeTestGene")
)

# Get path to sample data files included with the package
data_dir <- system.file("extdata", package = "damidBind")

# Run loading function using sample files and mock gene annotations
# Normalising with either 'quantile' or 'loess' is generally recommended
# for DamID log2 ratios
loaded_data <- load_data_peaks(
    binding_profiles_path = data_dir,
    peaks_path = data_dir,
    ensdb_genes = mock_genes_gr,
    norm_method = "quantile"
)
#> Locating binding profile files
#> Building binding profile dataframe from input files ...
#>  - Loaded: Bsh_Dam_L4_r1-ext300-vs-Dam.kde-norm
#>  - Loaded: Bsh_Dam_L4_r2-ext300-vs-Dam.kde-norm
#>  - Loaded: Bsh_Dam_L5_r1-ext300-vs-Dam.kde-norm
#>  - Loaded: Bsh_Dam_L5_r2-ext300-vs-Dam.kde-norm
#> Locating peak files
#> Applying 'quantile' normalisation to binding profiles
#> Calculating occupancy over peaks
#> Calculating average occupancy for 1208 regions...
#> Generating diagnostic plots...


# View the structure of the output
str(loaded_data, max.level = 1)
#> List of 6
#>  $ binding_profiles_data:Formal class 'GRanges' [package "GenomicRanges"] with 7 slots
#>  $ peaks                :List of 4
#>  $ pr                   :Formal class 'GRanges' [package "GenomicRanges"] with 7 slots
#>  $ occupancy            :'data.frame':	1208 obs. of  9 variables:
#>  $ test_category        : chr "bound"
#>  $ metadata             :List of 6
# View the structure of the output
str(loaded_data, max.level = 1)
#> List of 6
#> $ binding_profiles_data:Formal class 'GRanges' [package "GenomicRanges"] with 7 slots
#> $ peaks :List of 4
#> $ pr :Formal class 'GRanges' [package "GenomicRanges"] with 7 slots
#> $ occupancy :'data.frame': 1208 obs. of 9 variables:
#> $ test_category : chr "bound"
#> $ metadata :List of 6