Differential binding/expression analysis (`limma`)
Source:R/limma_functions.R
differential_binding.RdSetup and differential analysis for occupancy/binding experiments using `limma`. Accepts output from `load_data_peaks` or `load_data_genes`, prepares an experiment matrix, fits linear models, and returns DE loci.
Usage
differential_binding(
  data_list,
  cond,
  regex = FALSE,
  fdr = 0.05,
  eBayes_trend = TRUE,
  eBayes_robust = TRUE,
  plot_diagnostics = interactive(),
  filter_occupancy = TRUE,
  filter_threshold = 0,
  filter_positive_enrichment = TRUE,
  p_combine_method = c("stouffer", "fisher")
)
Arguments
- data_list
List. Output from load_data_peaks or load_data_genes.
- cond
A named or unnamed character vector of length two. The values are strings or regular expressions used to identify samples for each condition. If the vector is named, the names are used as user-friendly display names for the conditions in plots and outputs. If unnamed, the match strings are used as display names. The order determines the contrast, e.g., `cond[1]` vs `cond[2]`.
- regex
Logical. If `TRUE`, the strings in `cond` are treated as regular expressions for matching sample names. If `FALSE` (the default), fixed string matching is used.
- fdr
Numeric. FDR threshold for significance (default 0.05).
- eBayes_trend
Logical. If `TRUE`, the analysis will account for data heteroscedasticity, which is common in DamID-seq data. (default: TRUE)
- eBayes_robust
Logical. If `TRUE`, the fitted trend should be robust to outliers. Only useful when `eBayes_trend = TRUE`. Recommended for DamID-seq data. (default: TRUE)
- plot_diagnostics
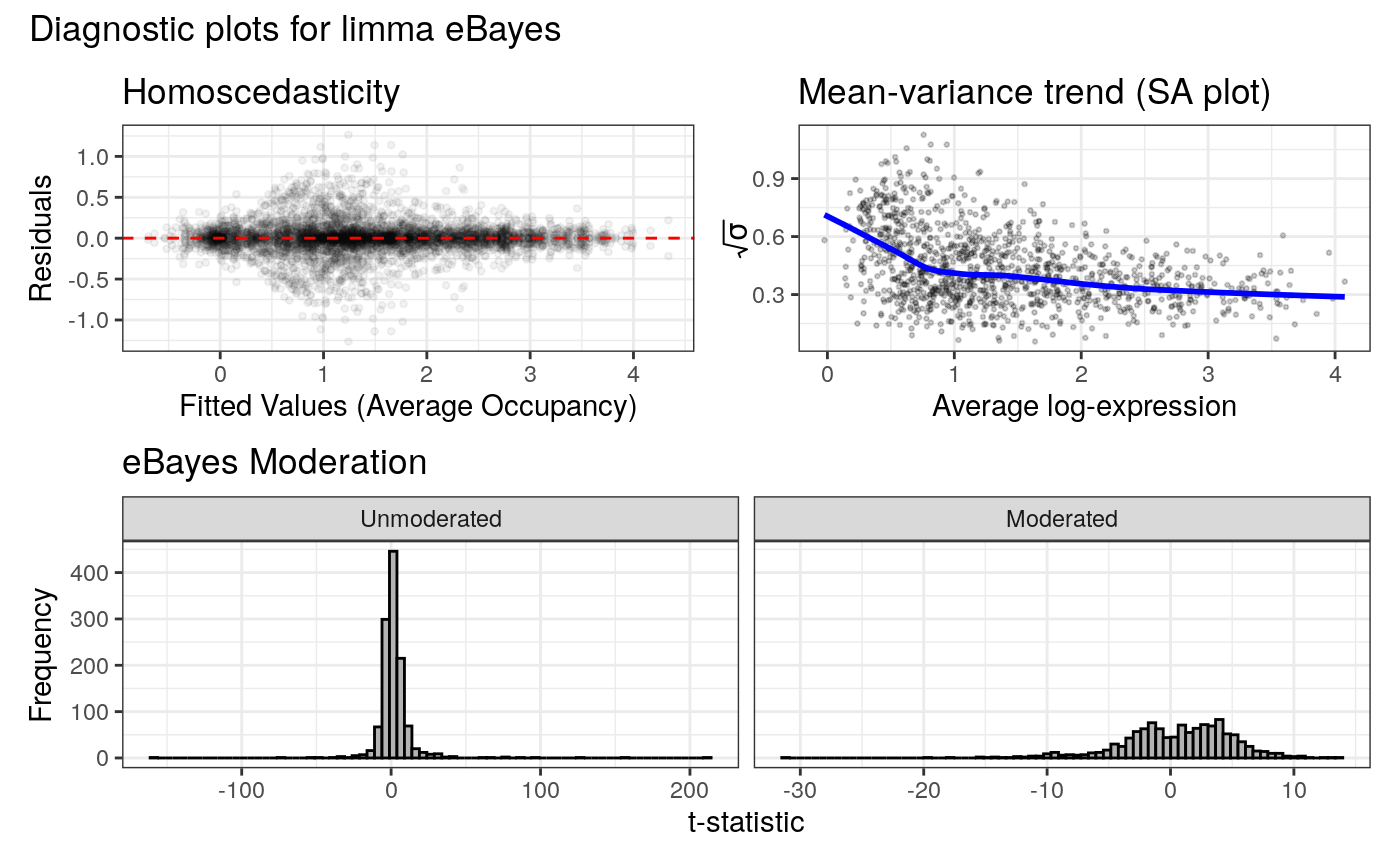
Logical. If `TRUE` (default for interactive sessions), plots limma diagnostics to assess eBayes moderation, using `plot_limma_diagnostics`.
- filter_occupancy
NULL or integer. Filters out any locus with occupancy > `filter_threshold` in fewer than this number of samples of any single condition when set. If set to TRUE, defaults to the minimum length of the two conditions. If FALSE or NULL, no filtering is applied. (default: TRUE)
- filter_threshold
Numeric. `filter_occupancy` uses this value for thresholding the input data. (default: 0)
- filter_positive_enrichment
Logical. If `TRUE` (default), regions are only considered significantly enriched if the mean score in the enriched condition is greater than zero. For example, for a region to be in `upCond1`, its logFC must be positive and its mean score in condition 1 must be > 0. Set to `FALSE` to include all statistically significant changes.
- p_combine_method
Method to combine p-values from replicates (default: "fisher")
Value
A `DamIDResults` object containing the results. Access slots using accessors:
- enrichedCond1()
data.frame of regions enriched in condition 1
- enrichedCond2()
data.frame of regions enriched in condition 2
- analysisTable()
data.frame of full results for all tested regions
- conditionNames()
A named character vector mapping display names to internal condition names
- inputData()
The original `data_list` input
Examples
# Create a mock GRanges object for gene annotations
# This object, based on the package's unit tests, avoids network access.
mock_genes_gr <- GenomicRanges::GRanges(
seqnames = S4Vectors::Rle("2L", 7),
ranges = IRanges::IRanges(
start = c(1000, 2000, 3000, 5000, 6000, 7000, 8000),
end = c(1500, 2500, 3500, 5500, 6500, 7500, 20000000)
),
strand = S4Vectors::Rle(GenomicRanges::strand(c("+", "-", "+", "+", "-", "-", "+"))),
gene_id = c("FBgn001", "FBgn002", "FBgn003", "FBgn004", "FBgn005", "FBgn006", "FBgn007"),
gene_name = c("geneA", "geneB", "geneC", "geneD", "geneE", "geneF", "LargeTestGene")
)
# Get path to sample data files included with the package
data_dir <- system.file("extdata", package = "damidBind")
# Load data
loaded_data <- load_data_peaks(
binding_profiles_path = data_dir,
peaks_path = data_dir,
ensdb_genes = mock_genes_gr,
quantile_norm = TRUE
)
#> Warning: The 'quantile_norm' argument is deprecated. Please use 'norm_method' instead.
#> Locating binding profile files
#> Building binding profile dataframe from input files ...
#> - Loaded: Bsh_Dam_L4_r1-ext300-vs-Dam.kde-norm
#> - Loaded: Bsh_Dam_L4_r2-ext300-vs-Dam.kde-norm
#> - Loaded: Bsh_Dam_L5_r1-ext300-vs-Dam.kde-norm
#> - Loaded: Bsh_Dam_L5_r2-ext300-vs-Dam.kde-norm
#> Locating peak files
#> Applying 'quantile' normalisation to binding profiles
#> Calculating occupancy over peaks
#> Calculating average occupancy for 1208 regions...
#> Generating diagnostic plots...

 # Run differential binding analysis
diff_results <- differential_binding(
loaded_data,
cond = c("L4 Neurons" = "L4", "L5 Neurons" = "L5")
)
#> Condition display names were sanitized for internal data:
#> 'L4 Neurons' -> 'L4.Neurons'
#> 'L5 Neurons' -> 'L5.Neurons'
#> Applying filter: Loci must have occupancy > 0 in at least 2 samples of at least one condition.
#> Filtered out 12 loci. 1196 loci remain for analysis.
#> Differential analysis setup:
#> Condition 1 Display Name: 'L4 Neurons' (Internal: 'L4.Neurons', Match Pattern: 'L4')
#> Found 2 replicates:
#> Bsh_Dam_L4_r1-ext300-vs-Dam.kde-norm_qnorm
#> Bsh_Dam_L4_r2-ext300-vs-Dam.kde-norm_qnorm
#> Condition 2 Display Name: 'L5 Neurons' (Internal: 'L5.Neurons', Match Pattern: 'L5')
#> Found 2 replicates:
#> Bsh_Dam_L5_r1-ext300-vs-Dam.kde-norm_qnorm
#> Bsh_Dam_L5_r2-ext300-vs-Dam.kde-norm_qnorm
#> limma contrasts: L4.Neurons-L5.Neurons
#> Applying eBayes moderation with `trend = TRUE, robust = TRUE`
#>
#> Filtering for positive enrichment (mean score > 0 in the enriched condition).
#>
#> 316 loci enriched in L4 Neurons
#> Highest-ranked genes:
#> LargeTestGene, LargeTestGene, LargeTestGene, LargeTestGene, LargeTestGene, LargeTestGene, LargeTestGene, LargeTestGene, LargeTestGene, LargeTestGene
#>
#> 166 loci enriched in L5 Neurons
#> Highest-ranked genes:
#> LargeTestGene, LargeTestGene, LargeTestGene, LargeTestGene, LargeTestGene, LargeTestGene, LargeTestGene, LargeTestGene, LargeTestGene, LargeTestGene
#> Displaying diagnostic plots...
# Run differential binding analysis
diff_results <- differential_binding(
loaded_data,
cond = c("L4 Neurons" = "L4", "L5 Neurons" = "L5")
)
#> Condition display names were sanitized for internal data:
#> 'L4 Neurons' -> 'L4.Neurons'
#> 'L5 Neurons' -> 'L5.Neurons'
#> Applying filter: Loci must have occupancy > 0 in at least 2 samples of at least one condition.
#> Filtered out 12 loci. 1196 loci remain for analysis.
#> Differential analysis setup:
#> Condition 1 Display Name: 'L4 Neurons' (Internal: 'L4.Neurons', Match Pattern: 'L4')
#> Found 2 replicates:
#> Bsh_Dam_L4_r1-ext300-vs-Dam.kde-norm_qnorm
#> Bsh_Dam_L4_r2-ext300-vs-Dam.kde-norm_qnorm
#> Condition 2 Display Name: 'L5 Neurons' (Internal: 'L5.Neurons', Match Pattern: 'L5')
#> Found 2 replicates:
#> Bsh_Dam_L5_r1-ext300-vs-Dam.kde-norm_qnorm
#> Bsh_Dam_L5_r2-ext300-vs-Dam.kde-norm_qnorm
#> limma contrasts: L4.Neurons-L5.Neurons
#> Applying eBayes moderation with `trend = TRUE, robust = TRUE`
#>
#> Filtering for positive enrichment (mean score > 0 in the enriched condition).
#>
#> 316 loci enriched in L4 Neurons
#> Highest-ranked genes:
#> LargeTestGene, LargeTestGene, LargeTestGene, LargeTestGene, LargeTestGene, LargeTestGene, LargeTestGene, LargeTestGene, LargeTestGene, LargeTestGene
#>
#> 166 loci enriched in L5 Neurons
#> Highest-ranked genes:
#> LargeTestGene, LargeTestGene, LargeTestGene, LargeTestGene, LargeTestGene, LargeTestGene, LargeTestGene, LargeTestGene, LargeTestGene, LargeTestGene
#> Displaying diagnostic plots...
 # View the results summary
diff_results
#> An object of class 'DamIDResults'
#> Differentially bound regions
#> Comparison: 'L4 Neurons' vs 'L5 Neurons'
#> - 316 regions enriched in L4 Neurons
#> - 166 regions enriched in L5 Neurons
#> - 1196 total regions tested
#>
#> Data provenance:
#> - Annotation: Manual (GRanges)
#> - Data: 4 binding profile(s), 4 peak file(s)
# View the results summary
diff_results
#> An object of class 'DamIDResults'
#> Differentially bound regions
#> Comparison: 'L4 Neurons' vs 'L5 Neurons'
#> - 316 regions enriched in L4 Neurons
#> - 166 regions enriched in L5 Neurons
#> - 1196 total regions tested
#>
#> Data provenance:
#> - Annotation: Manual (GRanges)
#> - Data: 4 binding profile(s), 4 peak file(s)