Perform Gene Ontology (GO) enrichment analysis for differentially bound/expressed regions
Source:R/analyse_go_terms.R
analyse_go_enrichment.RdThis function performs Gene Ontology (GO) enrichment analysis using `clusterProfiler` for either the up-regulated or down-regulated regions/genes identified by `differential_binding()` or `differential_accessibility()`. It automatically extracts the relevant gene IDs (gene_ids) and the background universe from the input `DamIDResults` object.
Usage
analyse_go_enrichment(
  diff_results,
  direction = "cond1",
  org_db = org.Dm.eg.db::org.Dm.eg.db,
  ontology = "BP",
  pvalue_cutoff = 0.05,
  qvalue_cutoff = 0.2,
  plot_title = NULL,
  show_category = 12,
  label_format_width = 50,
  wrap_labels = FALSE,
  fit_labels = FALSE,
  abbrev_terms = FALSE,
  abbrevs = c(regulation = "reg."),
  theme_size = 14,
  use_gse = FALSE,
  save = NULL,
  save_results_path = NULL,
  maxGSSize = 1000,
  minGSSize = 10,
  clean_gene_symbols = TRUE
)
Arguments
- diff_results
A `DamIDResults` object, as returned by `differential_binding()` or `differential_accessibility()`.
- direction
Character string. Specifies which set of genes to analyse, either using condition names, "cond1" or "cond2", or "all" (for all significantly enriched genes from either direction). Default is "cond1".
- org_db
An OrgDb object specifying the organism's annotation database. For Drosophila, use `org.Dm.eg.db::org.Dm.eg.db`.
- ontology
Character string. The GO ontology to use: "BP" (Biological Process), "MF" (Molecular Function), or "CC" (Cellular Component). Default is "BP".
- pvalue_cutoff
Numeric. Adjusted p-value cutoff for significance. Default: 0.05.
- qvalue_cutoff
Numeric. Q-value cutoff for significance. Default: 0.2.
- plot_title
Character string. Title for the generated dot plot.
- show_category
Integer. Number of top enriched GO categories to display in the plot. Default: 12.
- label_format_width
Integer. Max character length for GO term labels on the plot before wrapping. Default: 50.
- wrap_labels
Logical. Whether to wrap label text (TRUE) or truncate (FALSE) if greater than `label_format_width` (Default: FALSE)
- fit_labels
Set `label_format_width` to the largest label width (Default: FALSE)
- abbrev_terms
Logical. Whether to abbreviate common GO term words. (Default: FALSE)
- abbrevs
Named vector of abbreviations to use for `abbrev_terms`. (Default: `c("regulation" = "reg.")`)
- theme_size
Integer. Base theme size to set. Default: 14.
- use_gse
Logical. Whether to use GSEA via `gseGO` rather than GO enrichment analysis (via `enrichGO`). (Default: FALSE)
- save
List or `NULL`. Controls saving the plot to a file (dot plot). If `NULL`, `FALSE`, or `0`, the plot is not saved. If a `list`, it specifies saving parameters:
filename(character): The path and base name for the output file. If not specified, the default name "damidBind_GSEA_dotplot" is used.format(character): File format ("pdf", "svg", or "png"). Default is "pdf".width(numeric): Width of the plot in inches. Default is 6.height(numeric): Height of the plot in inches. Default is 6.
- save_results_path
Character string or NULL. If a path is provided (e.g., "go_results.csv"), the enrichment results table will be saved to this CSV file.
- maxGSSize
Integer. Maximum size of gene sets to consider. Default: 1000.
- minGSSize
Integer. Minimum size of gene sets to consider. Default: 10.
- clean_gene_symbols
Logical. Removes snoRNAs and tRNAs (common sources of accidental bias between different NGS methods) from the gene lists prior to enrichment analysis. Default: TRUE.
Value
A list containing:
- enrich_go_object
`enrichResult` object from `clusterProfiler`.
- results_table
Data frame of enrichment results.
- dot_plot
`ggplot` object of the dot plot.
NULL if no significant enrichment is found or if input validation fails.
Details
This function assumes that the `analysis` slot in the `diff_results` object contains a `gene_id` column. If this column is not present, or cannot be processed, the function will return NULL.
Examples
# This example requires the 'org.Dm.eg.db' package
if (requireNamespace("org.Dm.eg.db", quietly = TRUE)) {
# Helper function to create a sample DamIDResults object
.generate_example_results <- function() {
# Define a mock gene object. Note: Real, mappable FlyBase IDs are
# used for the 'gene_id' column to ensure the example runs.
mock_genes_gr <- GenomicRanges::GRanges(
seqnames = S4Vectors::Rle("2L", 7),
ranges = IRanges::IRanges(
start = c(1000, 2000, 3000, 5000, 6000, 7000, 8000),
end = c(1500, 2500, 3500, 5500, 6500, 7500, 20000000)
),
gene_id = c(
"FBgn0034439", "FBgn0031267", "FBgn0051138", "FBgn0031265",
"FBgn0004655", "FBgn0000251", "FBgn0000252"
),
gene_name = c("ap", "dpr1", "side", "dpr2", "eg", "bi", "br")
)
data_dir <- system.file("extdata", package = "damidBind")
loaded_data <- load_data_peaks(
binding_profiles_path = data_dir,
peaks_path = data_dir,
ensdb_genes = mock_genes_gr,
quantile_norm = TRUE
)
diff_results <- differential_binding(
loaded_data,
cond = c("L4 Neurons" = "L4",
"L5 Neurons" = "L5")
)
return(diff_results)
}
diff_results <- .generate_example_results()
# Run GO Enrichment for genes enriched in the first condition ("L4")
# Note: with tiny sample data, this may not find significant terms.
go_results <- analyse_go_enrichment(
diff_results,
direction = "L4",
org_db = org.Dm.eg.db::org.Dm.eg.db
)
# Print the results table if any enrichment was found
if (!is.null(go_results)) {
print(go_results$results_table)
}
}
#> Warning: The 'quantile_norm' argument is deprecated. Please use 'norm_method' instead.
#> Locating binding profile files
#> Building binding profile dataframe from input files ...
#> - Loaded: Bsh_Dam_L4_r1-ext300-vs-Dam.kde-norm
#> - Loaded: Bsh_Dam_L4_r2-ext300-vs-Dam.kde-norm
#> - Loaded: Bsh_Dam_L5_r1-ext300-vs-Dam.kde-norm
#> - Loaded: Bsh_Dam_L5_r2-ext300-vs-Dam.kde-norm
#> Locating peak files
#> Applying 'quantile' normalisation to binding profiles
#> Calculating occupancy over peaks
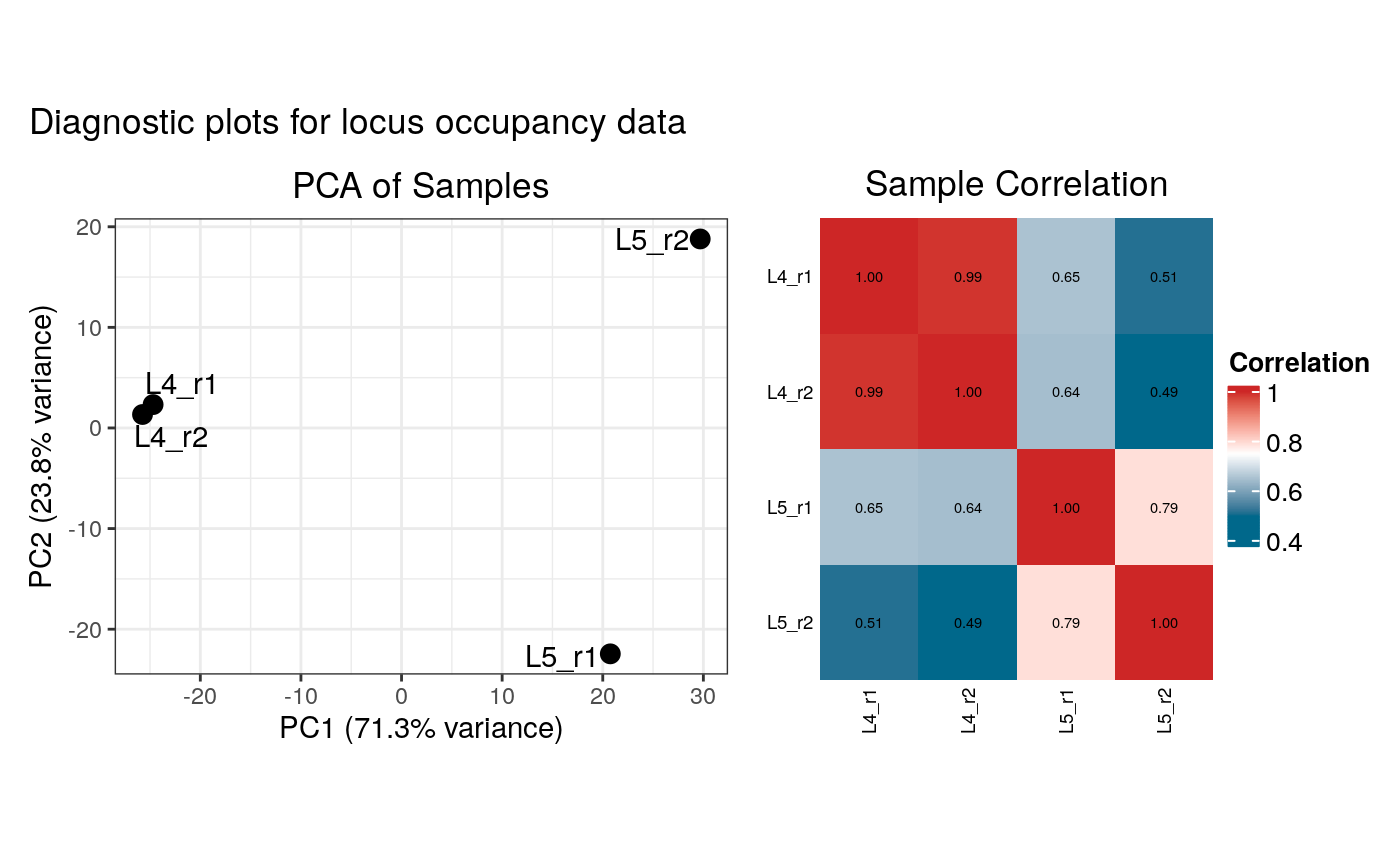
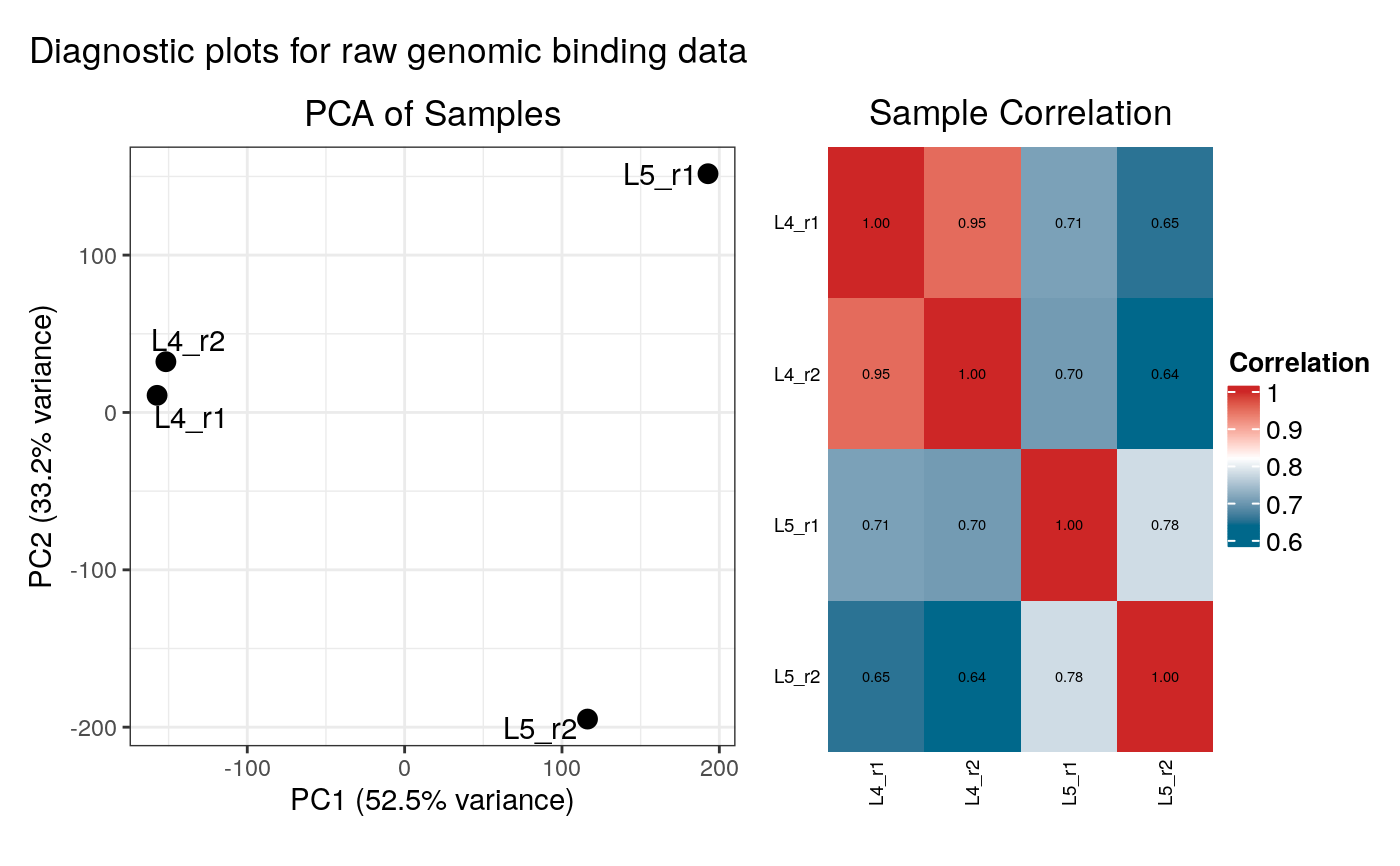
#> Calculating average occupancy for 1208 regions...
#> Generating diagnostic plots...
 #> Condition display names were sanitized for internal data:
#> 'L4 Neurons' -> 'L4.Neurons'
#> 'L5 Neurons' -> 'L5.Neurons'
#> Applying filter: Loci must have occupancy > 0 in at least 2 samples of at least one condition.
#> Filtered out 12 loci. 1196 loci remain for analysis.
#> Differential analysis setup:
#> Condition 1 Display Name: 'L4 Neurons' (Internal: 'L4.Neurons', Match Pattern: 'L4')
#> Found 2 replicates:
#> Bsh_Dam_L4_r1-ext300-vs-Dam.kde-norm_qnorm
#> Bsh_Dam_L4_r2-ext300-vs-Dam.kde-norm_qnorm
#> Condition 2 Display Name: 'L5 Neurons' (Internal: 'L5.Neurons', Match Pattern: 'L5')
#> Found 2 replicates:
#> Bsh_Dam_L5_r1-ext300-vs-Dam.kde-norm_qnorm
#> Bsh_Dam_L5_r2-ext300-vs-Dam.kde-norm_qnorm
#> limma contrasts: L4.Neurons-L5.Neurons
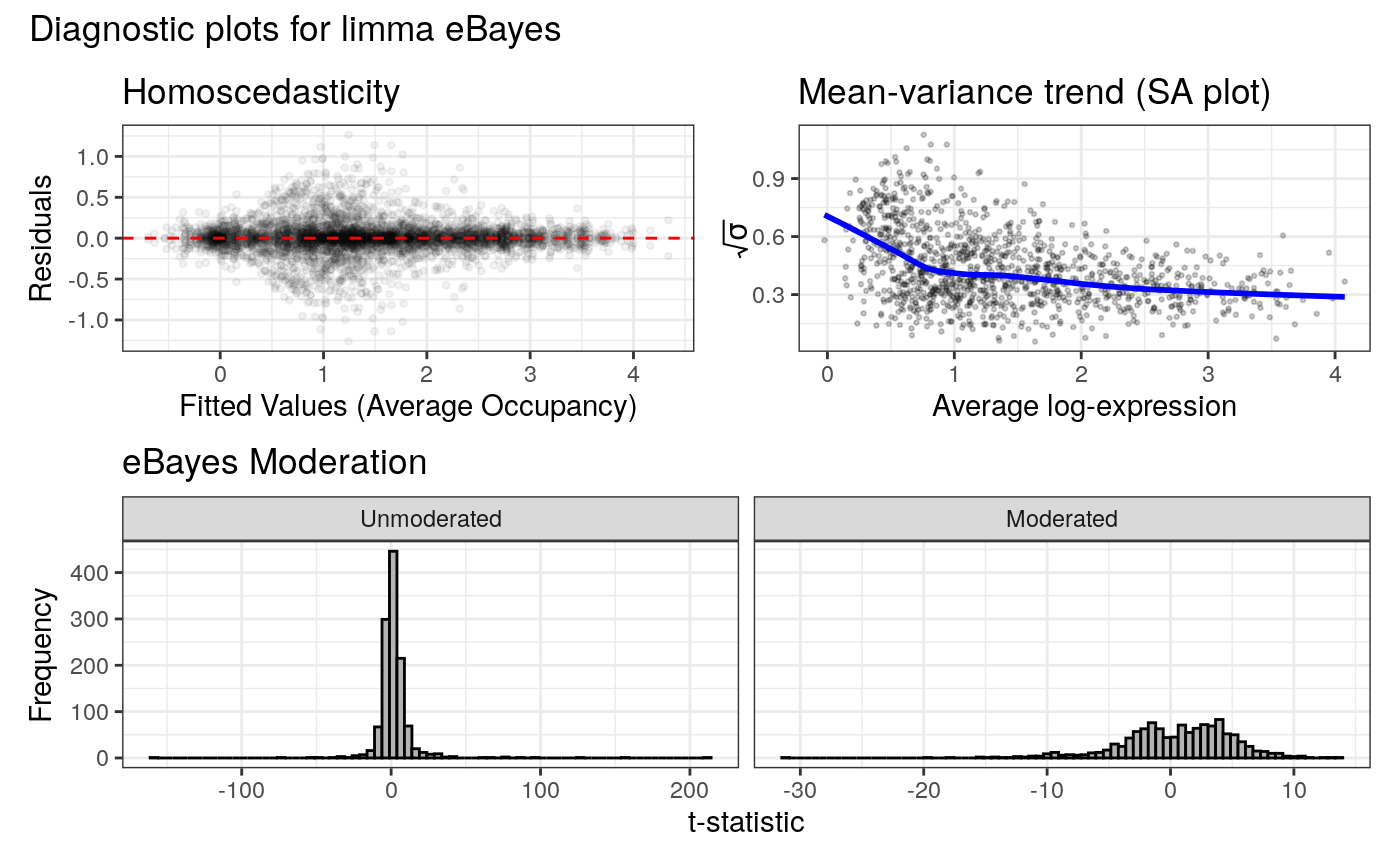
#> Applying eBayes moderation with `trend = TRUE, robust = TRUE`
#>
#> Filtering for positive enrichment (mean score > 0 in the enriched condition).
#>
#> 316 loci enriched in L4 Neurons
#> Highest-ranked genes:
#> br, br, br, br, br, br, br, br, br, br
#>
#> 166 loci enriched in L5 Neurons
#> Highest-ranked genes:
#> br, br, br, br, br, br, br, br, br, br
#> Displaying diagnostic plots...
#> Condition display names were sanitized for internal data:
#> 'L4 Neurons' -> 'L4.Neurons'
#> 'L5 Neurons' -> 'L5.Neurons'
#> Applying filter: Loci must have occupancy > 0 in at least 2 samples of at least one condition.
#> Filtered out 12 loci. 1196 loci remain for analysis.
#> Differential analysis setup:
#> Condition 1 Display Name: 'L4 Neurons' (Internal: 'L4.Neurons', Match Pattern: 'L4')
#> Found 2 replicates:
#> Bsh_Dam_L4_r1-ext300-vs-Dam.kde-norm_qnorm
#> Bsh_Dam_L4_r2-ext300-vs-Dam.kde-norm_qnorm
#> Condition 2 Display Name: 'L5 Neurons' (Internal: 'L5.Neurons', Match Pattern: 'L5')
#> Found 2 replicates:
#> Bsh_Dam_L5_r1-ext300-vs-Dam.kde-norm_qnorm
#> Bsh_Dam_L5_r2-ext300-vs-Dam.kde-norm_qnorm
#> limma contrasts: L4.Neurons-L5.Neurons
#> Applying eBayes moderation with `trend = TRUE, robust = TRUE`
#>
#> Filtering for positive enrichment (mean score > 0 in the enriched condition).
#>
#> 316 loci enriched in L4 Neurons
#> Highest-ranked genes:
#> br, br, br, br, br, br, br, br, br, br
#>
#> 166 loci enriched in L5 Neurons
#> Highest-ranked genes:
#> br, br, br, br, br, br, br, br, br, br
#> Displaying diagnostic plots...
 #> Universe of Gene IDs is too small. Returning NULL.