Verify Underlying Assumptions for `limma` Analysis
Source:R/diagnostic_plots.R
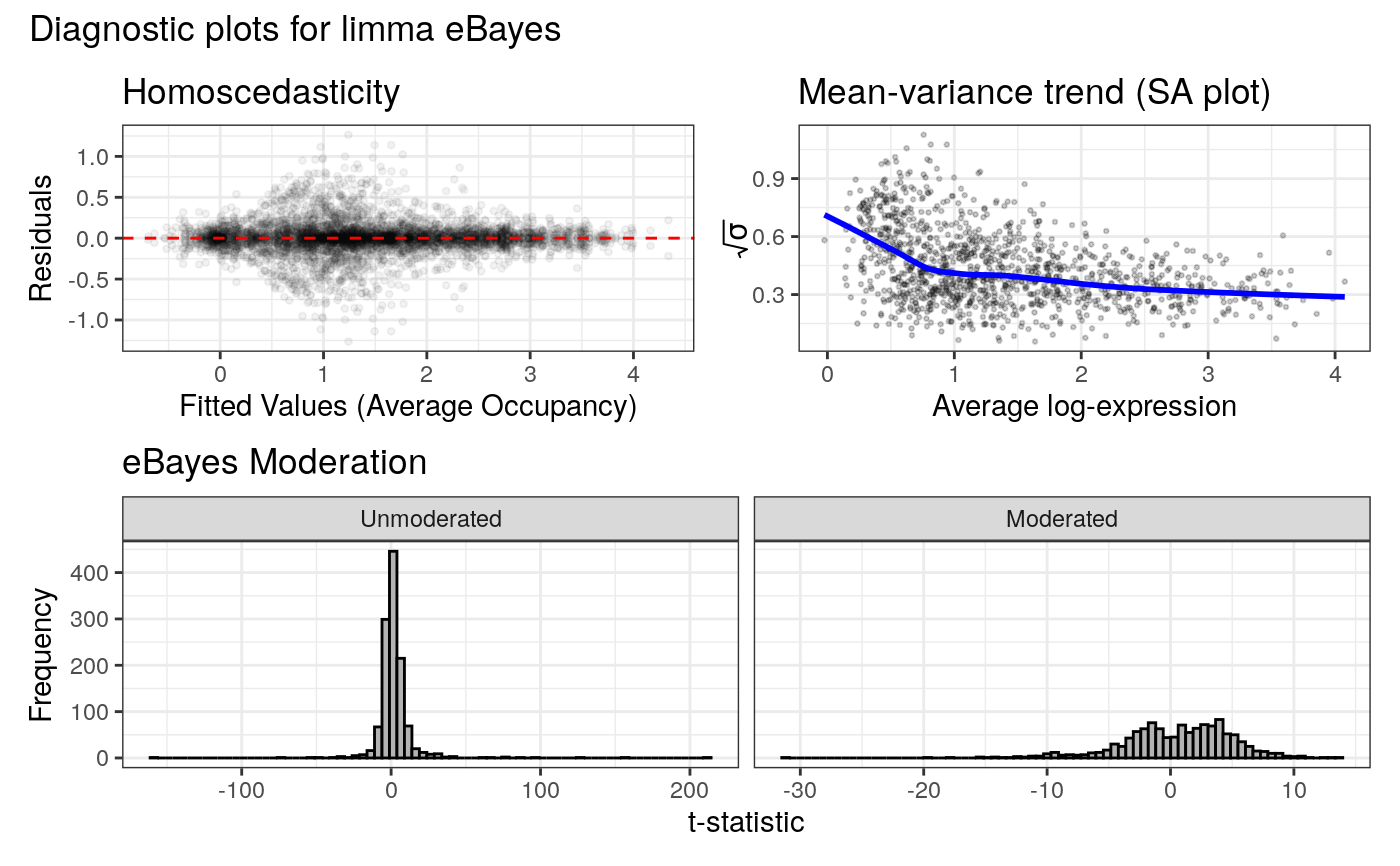
plot_limma_diagnostics.RdThis diagnostic function is a wrapper around the internal `._plot_limma_diagnostics_internal()` function, to help assess whether the assumptions of the `limma` empirical Bayes framework hold for a given dataset. It generates a series of plots to check for normality of residuals, homoscedasticity, and the mean-variance relationship, illustrating in particular the effect of `trend` and `robust` parameters to `limma::eBayes`.
During `limma`-based fits, the internal plot routine is called by default. This wrapper allows diagnostics to be displayed for any given log2 ratio-based `data_list` object from `load_data_peaks()` or `load_data_genes()`, and the effect of moderation parameters on the fit tested.
Usage
plot_limma_diagnostics(
  data_list,
  cond,
  drop_samples = NULL,
  filter_occupancy = TRUE,
  filter_threshold = 0,
  eBayes_trend = TRUE,
  eBayes_robust = TRUE,
  regex = FALSE
)
Arguments
- data_list
List. The output from `load_data_peaks` or `load_data_genes`.
- cond
A named character vector of length two defining the conditions for comparison, identical to the `cond` argument in `differential_binding`.
- drop_samples
An optional character vector of sample names or patterns to remove for this diagnostic check. Default: `NULL`.
- filter_occupancy
NULL or integer. See `prep_data_for_differential_analysis`. Default is `TRUE`.
- filter_threshold
Numeric. Threshold value for `filter_occupancy`. (default: 0)
- eBayes_trend
Logical. See `limma::eBayes`. Default: `TRUE`
- eBayes_robust
Logical. See `limma::eBayes`. Default: `TRUE`
- regex
Logical. Whether to use regular expressions for matching condition names. Default is `FALSE`.
Value
Invisibly returns `NULL`. This function is called to generate diagnostic plots in the active graphics device.
Details
The function first prepares the data and fits a linear model using the `limma` package. It then calls an internal plotting routine to generate the following checks:
Homoscedasticity (Residuals vs. Fitted): A scatter plot of model residuals against fitted values. A random cloud around y=0 supports the assumption of constant variance.
Effect of eBayes moderation: Histograms of t-statistics before and after empirical Bayes moderation.
Mean-variance trend (`plotSA`): The primary diagnostic for the `eBayes` step, showing the relationship between average log2 occupancy and variance. Points should be evenly distributed around the blue trendline; any outliers are highlighted in red.
The function uses the internal `prep_data_for_differential_analysis` function to ensure that the data being tested is identical to that used in the main differential analysis.
Examples
mock_genes_gr <- GenomicRanges::GRanges(
    seqnames = S4Vectors::Rle("2L", 7),
    ranges = IRanges::IRanges(
        start = c(1000, 2000, 3000, 5000, 6000, 7000, 8000),
        end = c(1500, 2500, 3500, 5500, 6500, 7500, 20000000)
    ),
    gene_id = c("FBgn001", "FBgn002", "FBgn003", "FBgn004", "FBgn005", "FBgn006", "FBgn007"),
    gene_name = c("geneA", "geneB", "geneC", "geneD", "geneE", "geneF", "LargeTestGene")
)

data_dir <- system.file("extdata", package = "damidBind")

loaded_data <- load_data_peaks(
    binding_profiles_path = data_dir,
    peaks_path = data_dir,
    ensdb_genes = mock_genes_gr,
    quantile_norm = TRUE,
    plot_diagnostics = FALSE
)
#> Warning: The 'quantile_norm' argument is deprecated. Please use 'norm_method' instead.
#> Locating binding profile files
#> Building binding profile dataframe from input files ...
#>  - Loaded: Bsh_Dam_L4_r1-ext300-vs-Dam.kde-norm
#>  - Loaded: Bsh_Dam_L4_r2-ext300-vs-Dam.kde-norm
#>  - Loaded: Bsh_Dam_L5_r1-ext300-vs-Dam.kde-norm
#>  - Loaded: Bsh_Dam_L5_r2-ext300-vs-Dam.kde-norm
#> Locating peak files
#> Applying 'quantile' normalisation to binding profiles
#> Calculating occupancy over peaks
#> Calculating average occupancy for 1208 regions...

conditions <- c("L4 Neurons" = "L4", "L5 Neurons" = "L5")

plot_limma_diagnostics(
    data_list = loaded_data,
    cond = conditions
)
#> Preparing data using 'prep_data_for_differential_analysis'...
#> Condition display names were sanitized for internal data:
#>   'L4 Neurons' -> 'L4.Neurons'
#>   'L5 Neurons' -> 'L5.Neurons'
#> Applying filter: Loci must have occupancy > 0 in at least 2 samples of at least one condition.
#>   Filtered out 12 loci. 1196 loci remain for analysis.
#> Differential analysis setup:
#> Condition 1 Display Name: 'L4 Neurons' (Internal: 'L4.Neurons', Match Pattern: 'L4')
#>   Found 2 replicates:
#>     Bsh_Dam_L4_r1-ext300-vs-Dam.kde-norm_qnorm
#>     Bsh_Dam_L4_r2-ext300-vs-Dam.kde-norm_qnorm
#> Condition 2 Display Name: 'L5 Neurons' (Internal: 'L5.Neurons', Match Pattern: 'L5')
#>   Found 2 replicates:
#>     Bsh_Dam_L5_r1-ext300-vs-Dam.kde-norm_qnorm
#>     Bsh_Dam_L5_r2-ext300-vs-Dam.kde-norm_qnorm
#> Fitting linear model with 'lmFit'...
#> Running empirical Bayes moderation with 'eBayes'...
#>   Displaying diagnostic plots...